

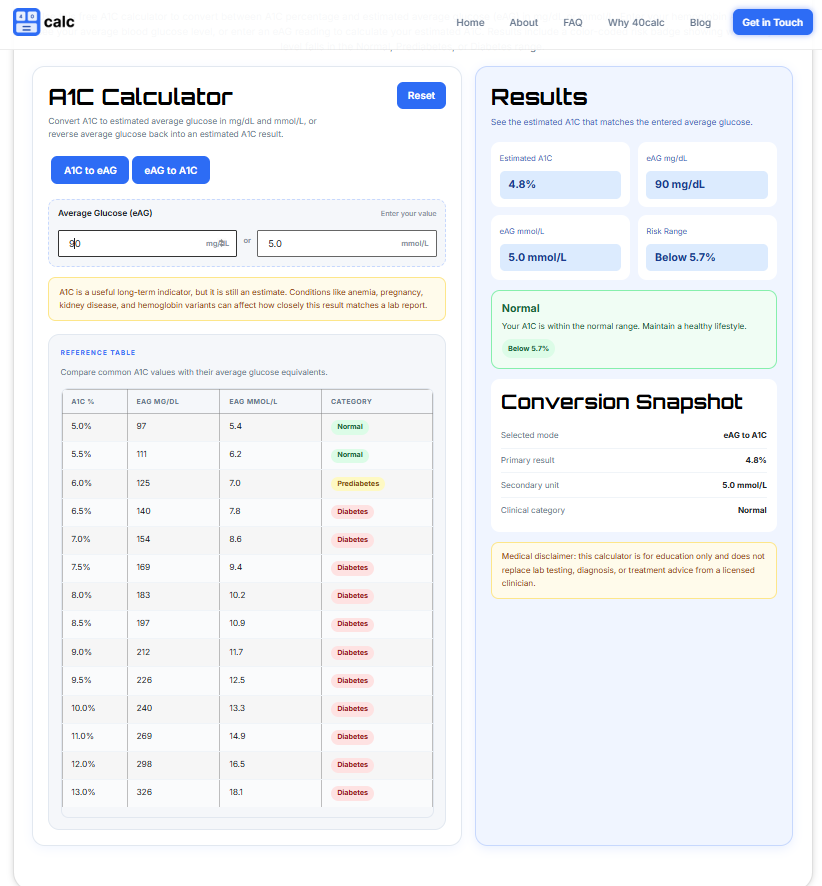
This A1C calculator based on average glucose works in two directions — enter your A1C percentage to get your estimated average glucose, or enter your average glucose reading to get your estimated A1C value.
Step 1 — Choose your conversion direction Select A1C to eAG if you want to convert an A1C percentage into an average glucose value. Select eAG to A1C if you already know your average blood glucose and want to find the matching A1C percentage.
Step 2 — Enter your value Type your A1C percentage into the A1C field, or enter your average glucose in either mg/dL or mmol/L. The mg/dL to A1C calculator automatically syncs both unit fields so you only need to fill in one.
Step 3 — Read your result Your converted value appears instantly in the Results panel alongside your clinical category — Normal, Prediabetes, or Diabetes — based on American Diabetes Association guidelines.
Step 4 — Use the result as context only This calculator is an estimation tool. Always confirm any A1C result with a certified laboratory blood test and discuss the outcome with your healthcare provider before making any health decisions.
The A1C calculator formula used on this page is derived from the ADAG (A1C-Derived Average Glucose) study, published in Diabetes Care by Nathan et al. (2008). This is the same formula used by the American Diabetes Association and most clinical diabetes management tools.
A1C to eAG (mg/dL) eAG = (28.7 × A1C) − 46.7
A1C to eAG (mmol/L) eAG = (1.59 × A1C) − 2.59
eAG (mg/dL) to A1C A1C = (eAG + 46.7) ÷ 28.7
eAG (mmol/L) to A1C A1C = (eAG + 2.59) ÷ 1.59
mg/dL to mmol/L conversion mmol/L = mg/dL ÷ 18.01559
All four conversions are available in the calculator above. The mg/dL to A1C calculator direction is particularly useful for people who monitor blood sugar with a glucometer and want to estimate their expected A1C before a lab appointment.
A1C reflects a 2 to 3 month average Unlike a fasting glucose test that measures your blood sugar at a single point in time, A1C measures the percentage of hemoglobin coated with glucose over the past 2 to 3 months. This makes it one of the most reliable long-term indicators of blood sugar control.
The result is an estimate, not a diagnosis The A1C calculator based on average glucose produces a statistical estimate based on population data. Individual results can vary depending on red blood cell lifespan, hydration levels, and metabolic differences between people.
Medical conditions can affect accuracy Conditions including sickle cell disease, iron deficiency anemia, kidney disease, liver disease, and recent blood transfusions can cause A1C readings to appear higher or lower than your true average glucose. If you have any of these conditions, your doctor may use alternative tests such as fructosamine or continuous glucose monitoring instead.
Lab timing and trend matter more than a single number A single A1C value tells only part of the story. Tracking A1C results over multiple tests, alongside fasting glucose and post-meal readings, gives a far more complete picture of blood sugar management.
| Category | A1C Level | eAG mg/dL | eAG mmol/L |
|---|---|---|---|
| Normal | Below 5.7% | Below 117 | Below 6.5 |
| Prediabetes | 5.7% – 6.4% | 117 – 137 | 6.5 – 7.6 |
| Diabetes | 6.5% and above | 140 and above | 7.8 and above |
| Well-managed Diabetes | Below 7.0% | Below 154 | Below 8.6 |
Ranges are based on American Diabetes Association guidelines for non-pregnant adults. Target ranges for children, elderly individuals, and pregnant women may differ — always confirm targets with your healthcare provider.